Bacterial Growth Curve
Understanding how bacteria grow is fundamental in microbiology. The bacterial growth curve explains how a bacterial population changes over time when cultured in a closed system. This concept is essential for students, researchers, and professionals working in medical microbiology, industrial microbiology, and environmental microbiology.
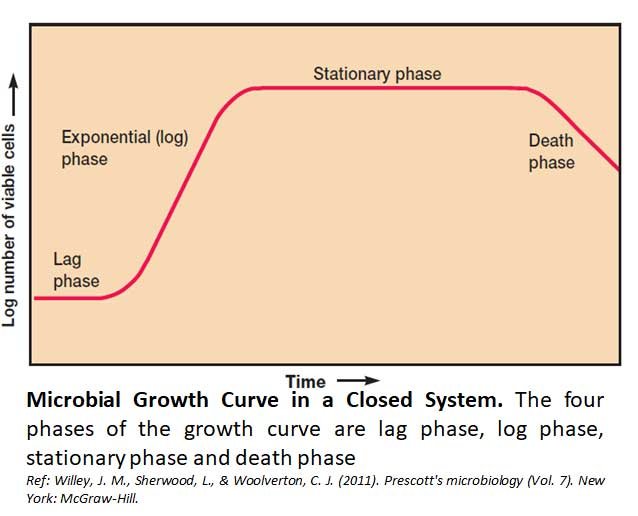
When bacteria are grown in a liquid medium under laboratory conditions, they are usually cultivated in a batch culture (closed system). In this system, no fresh nutrients are added during incubation. As growth proceeds, nutrients gradually decline while metabolic waste products accumulate. When the number of viable cells is plotted on a logarithmic scale against time, a characteristic four-phase growth pattern is observed. You can download the complete notes in PDF format using the link provided below for easy reference and offline study.
Microbiology Notes | Microbiology MCQs | Microbiology PPTs
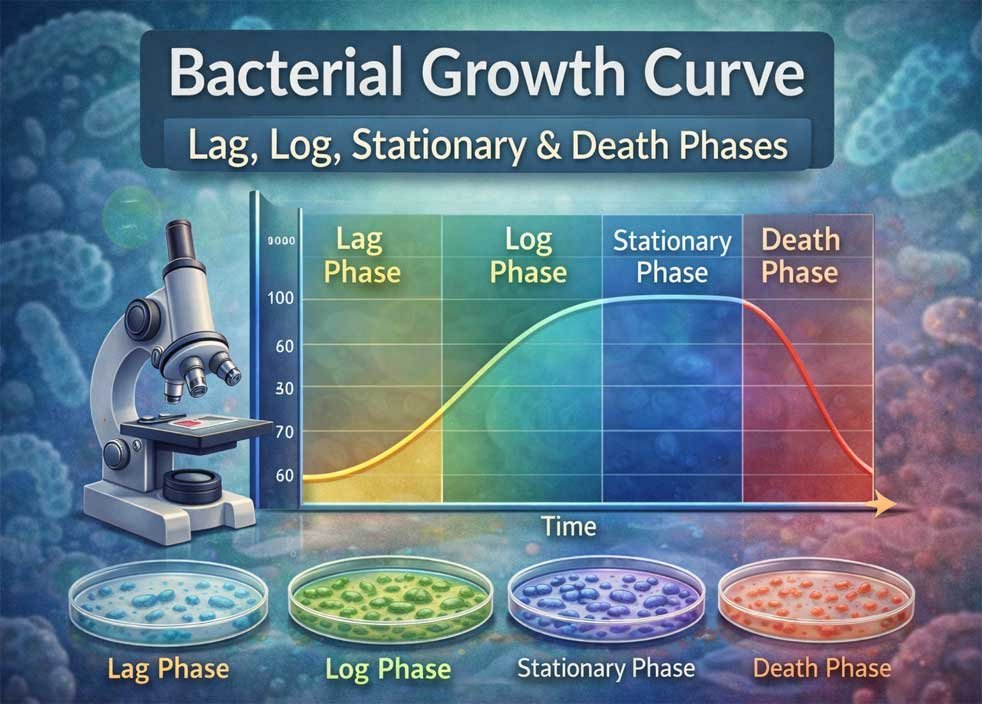
The bacterial growth curve consists of four main phases:
- Lag Phase
- Log (Exponential) Phase
- Stationary Phase
- Death Phase
1. Lag Phase
The lag phase is the initial adjustment period after bacteria are introduced into fresh culture medium. During this stage, there is no immediate increase in cell number.
Although cells are not dividing, they remain metabolically active. They synthesize enzymes, ATP, ribosomes, and other components necessary for growth. If the new medium differs from the previous one, bacteria must produce new enzymes to utilize available nutrients. Injured or aged cells may also require time for repair before active division begins.
The duration of the lag phase depends on:
- Age and physiological condition of the inoculum
- Nutritional composition of the medium
- Environmental factors such as temperature
Young, actively growing cells transferred into a similar medium show a short lag phase. In contrast, older or stressed cultures display a longer adaptation period.
2. Log (Exponential) Phase
The log phase, also known as the exponential phase, is the period of rapid cell division. During this stage, bacteria multiply at their maximum possible rate under optimal conditions.
Cell numbers double at regular intervals, producing a smooth upward curve when plotted on a logarithmic scale. The population is most uniform during this phase in terms of structure, metabolism, and biochemical activity. For this reason, log-phase cells are commonly used in laboratory research and experimental studies.
This phase represents balanced growth, meaning all cellular components are synthesized proportionally.
Changes in Growth Conditions
When environmental conditions change, bacteria may experience unbalanced growth.
- Shift-up (poor to rich medium): Ribosome production increases first, followed by enhanced protein and DNA synthesis. Growth rate eventually rises.
- Shift-down (rich to poor medium): Cells synthesize enzymes required for biosynthesis. Temporary reduction in cell size may occur before balanced growth resumes.
You may also like NOTES in... BOTANY BIOCHEMISTRY MOL. BIOLOGY ZOOLOGY MICROBIOLOGY BIOSTATISTICS ECOLOGY IMMUNOLOGY BIOTECHNOLOGY GENETICS EMBRYOLOGY PHYSIOLOGY EVOLUTION BIOPHYSICS BIOINFORMATICS
Effect of Nutrient Levels
The growth rate increases with nutrient concentration up to a certain limit. Once transport systems become saturated, further nutrient increases do not enhance growth. The final cell yield depends largely on the amount of the limiting nutrient available.
3. Stationary Phase
As nutrients become limited and waste products accumulate, bacterial growth slows and eventually stops. This stage is known as the stationary phase.
During this phase:
- The number of viable cells remains relatively constant
- Cell division may balance cell death
- Some cells remain metabolically active without dividing
Causes of Stationary Phase
Several factors contribute to the onset of the stationary phase:
- Depletion of essential nutrients
- Limited oxygen availability in aerobic cultures
- Accumulation of toxic metabolic byproducts
- High population density
For example, acid-producing bacteria can lower the pH of their environment, inhibiting further growth.
Survival During Starvation
Instead of forming spores, many bacteria adapt to nutrient limitation through physiological changes such as:
- Reduction in cell size
- DNA protection mechanisms
- Production of stress-response proteins
- Strengthening of the cell wall
These adaptations increase resistance to heat, oxidative stress, osmotic pressure, and disinfectants. Some species can survive starvation for extended periods. Certain pathogens, such as Salmonella typhimurium, may even show increased virulence under nutrient-limited conditions.
4. Death Phase
When environmental conditions become severely unfavorable, the number of viable cells begins to decline. This stage is called the death phase.
Cell death often follows a logarithmic pattern, meaning a constant percentage of the population dies over time. Even if the total cell count appears stable, many cells may no longer be capable of reproduction.
In microbiology, a cell is considered dead when it irreversibly loses the ability to grow and divide in fresh medium. The death curve may not always be smooth because some highly resistant cells survive longer than others.
Summary of the Bacterial Growth Curve
The bacterial growth curve in batch culture consists of four predictable stages:
- Lag Phase – Adaptation and preparation for cell division
- Log Phase – Rapid and balanced multiplication
- Stationary Phase – Growth ceases due to nutrient limitation and stress
- Death Phase – Decline in viable cell numbers
A clear understanding of the bacterial growth curve is essential in clinical diagnostics, biotechnology, pharmaceutical production, food microbiology, and industrial fermentation processes.
MCQs: Bacterial Growth Curve
1. In which phase are bacteria metabolically active but not increasing in number?
- A. Log phase
- B. Stationary phase
- C. Lag phase
- D. Death phase
Correct Answer: C. Lag phase
Explanation: During the lag phase, cells synthesize enzymes, ATP, and ribosomes but do not divide immediately.
2. During which phase do bacterial cells divide at their maximum rate?
- A. Lag phase
- B. Log (Exponential) phase
- C. Stationary phase
- D. Death phase
Correct Answer: B. Log (Exponential) phase
Explanation: In the log phase, cells double at regular intervals and exhibit balanced growth.
3. What primarily determines the final cell yield in a batch culture?
- A. Temperature only
- B. Ribosome production
- C. Amount of limiting nutrient
- D. Oxygen concentration only
Correct Answer: C. Amount of limiting nutrient
Explanation: The total biomass produced depends largely on the availability of the limiting nutrient.
4. Why does the stationary phase occur?
- A. Cells stop synthesizing proteins
- B. Nutrients are depleted and waste accumulates
- C. DNA replication permanently stops
- D. All cells become dormant
Correct Answer: B. Nutrients are depleted and waste accumulates
Explanation: Growth ceases due to nutrient limitation, oxygen restriction, accumulation of toxic metabolites, and high population density.
5. In a shift-up condition (poor to rich medium), what happens first?
- A. Immediate DNA replication
- B. Cell death
- C. Increased ribosome production
- D. Decreased cell size
Correct Answer: C. Increased ribosome production
Explanation: Cells first increase ribosome synthesis before enhancing protein and DNA synthesis.
6. During the death phase, bacterial death usually follows which pattern?
- A. Linear increase
- B. Random fluctuation
- C. Logarithmic decline
- D. Immediate total death
Correct Answer: C. Logarithmic decline
Explanation: A constant percentage of cells die per unit time, producing a logarithmic decline pattern.
7. Which phase is most suitable for laboratory experiments requiring uniform cells?
- A. Lag phase
- B. Log phase
- C. Stationary phase
- D. Death phase
Correct Answer: B. Log phase
Explanation: Cells in the log phase are metabolically active and uniform in size, structure, and biochemical composition.
Study offline!!! Download this Note in PDF
Reference: Willey, J. M., Sherwood, L., & Woolverton, C. J. (2011). Prescott’s microbiology (Vol. 7). New York: McGraw-Hill.
<<< Back to Microbiology Notes Page
You may also like... NOTES QUESTION BANK COMPETITIVE EXAMS. PPTs UNIVERSITY EXAMS DIFFERENCE BETWEEN.. MCQs PLUS ONE BIOLOGY NEWS & JOBS MOCK TESTS PLUS TWO BIOLOGY PRACTICAL